Read through our market commentary here, or skip to Jason’s March 2022 Market Update video below.
It is important to understand that no one can predict the future, not even us! What we do as money managers is to research the most probable outcomes and how to position a portfolio in light of these considerations. There’s no way to know for sure how the Russia-Ukraine war will end, however, we believe a likely outcome is that Russia will be unable to take over the entire nation of Ukraine and will potentially settle for regions in the southeast, while also providing Russia a “land bridge” to the Crimean Peninsula. We also believe that sanctions from the West will continue for a longer period, which may cause inflation to remain elevated.
Past Global Events
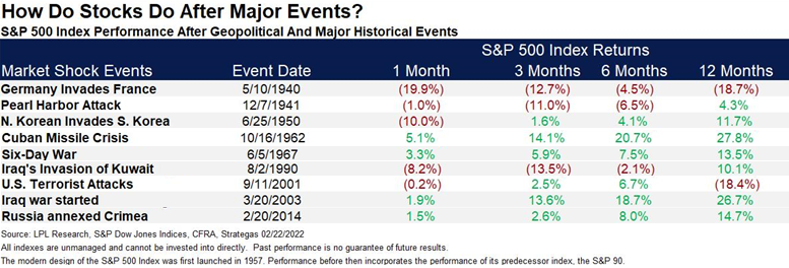
Just as in the last market update, we point out major world events of similar scale and research subsequent market performance in this market update, seen in the table above. In 1941 was the Pearl Harbor attack, which is arguably the worst event in terms of world consequences, as it officially brought the United States into WWII. The S&P 500 took initial hits in the months following the attack, but 12 months later it returned to a positive 4.3%. Over the last 70 years or so, there have been several events like the Russia-Ukraine invasion that increase market volatility shortly after they begin. After initial downturns, markets tend to be resilient and recover over time.
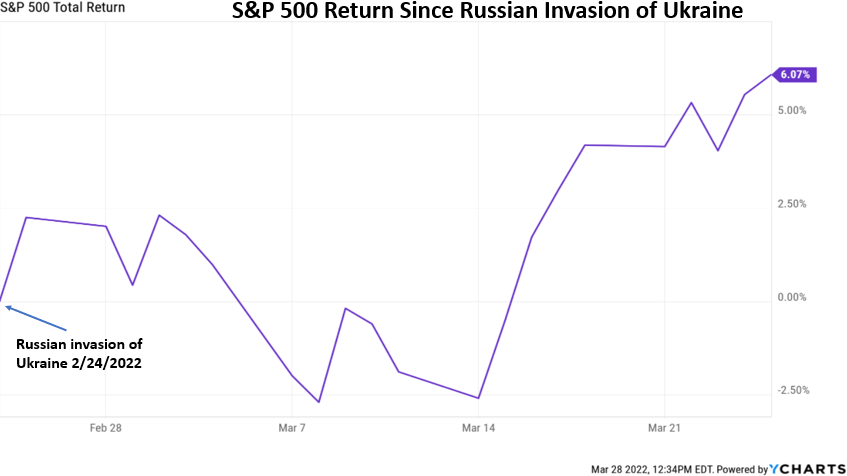
Looking at where we are today in the Russia-Ukraine conflict, Russia began the invasion of Ukraine on 2/24/2022. Seen on the chart below, the market declined initially, but as of today, March 28th, the S&P 500 is now up 6.07% since February 24th. Increased volatility and fear in the markets caused by global conflicts can present potential opportunities for investors that require us to stay ready and disciplined when managing money.
S&P 500 vs. Emerging Markets
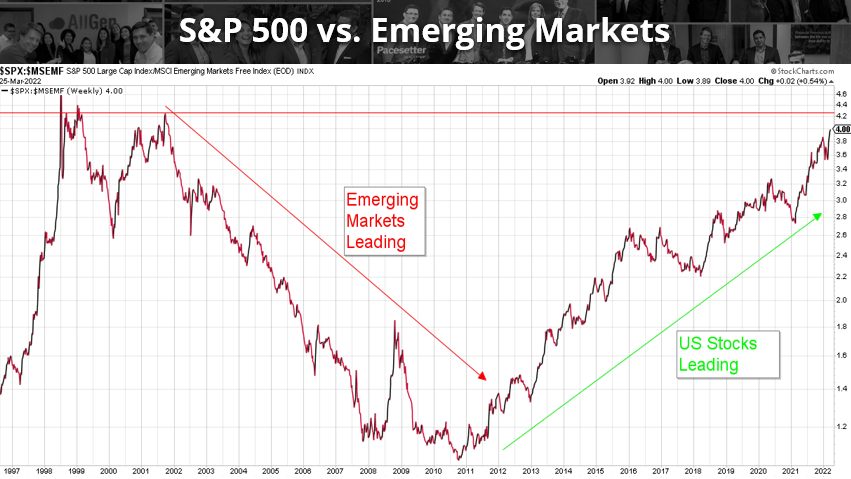
Market sectors tend to outperform each other in pendulum-like swings over time. In this example, we study the relationship between the S&P 500 vs. emerging markets. When the line is declining, emerging markets are outperforming and when the line is rising, the S&P 500 is outperforming. It’s easy to see that since late 2010, the S&P 500 has outperformed emerging markets. Currently, we are approaching a level of resistance (the red horizontal line) that could indicate a pendulum shift in emerging markets’ outperformance going forward. This relationship is something we are monitoring, as we believe there are opportunities in emerging market stocks.
International Markets in General
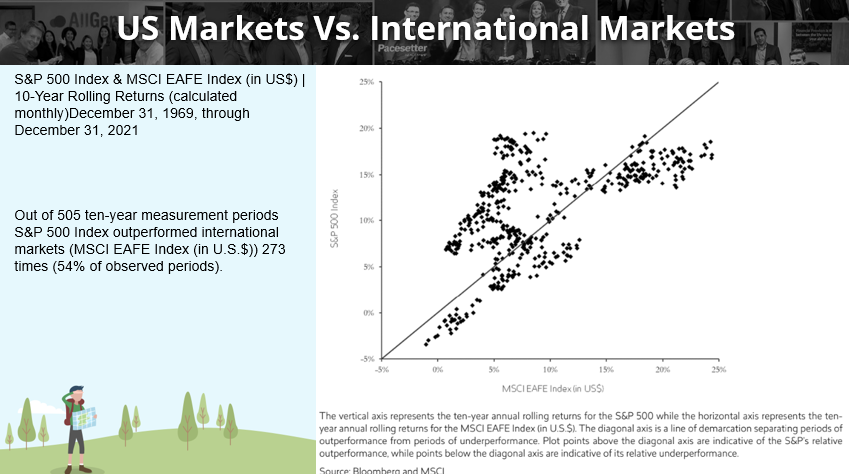
When comparing U.S. stocks vs non-US stocks, U.S. stocks have outperformed international for the last 14 years: the longest period since the early 1970s. This doesn’t mean that international will certainly outperform going forward, but rather it supports the idea that these two sectors go through periods of outperforming the other. Each dot on the chart below represents a rolling ten-year period. Dots above the solid black line represent ten-year periods where the S&P 500 outperforms and dots below the line indicate ten-year periods where international outperforms. Of all these observations, U.S. stocks have outperformed about 54% of the time, indicating that outperformance between these two sectors has been relatively split throughout history.
Market Valuations
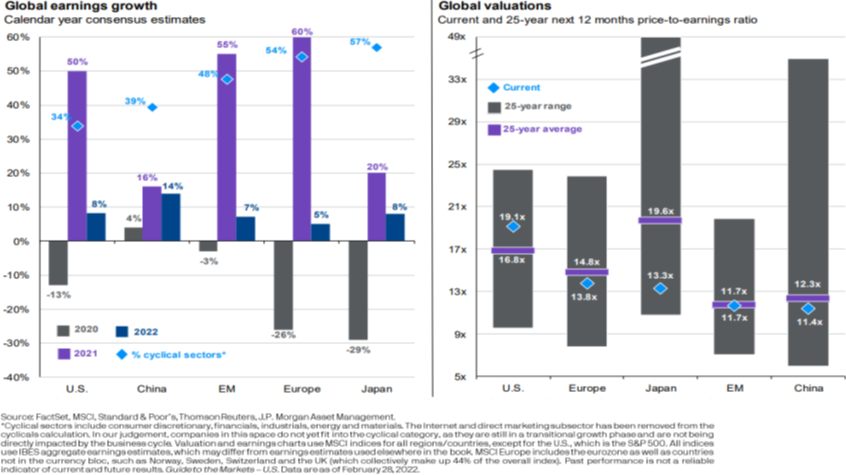
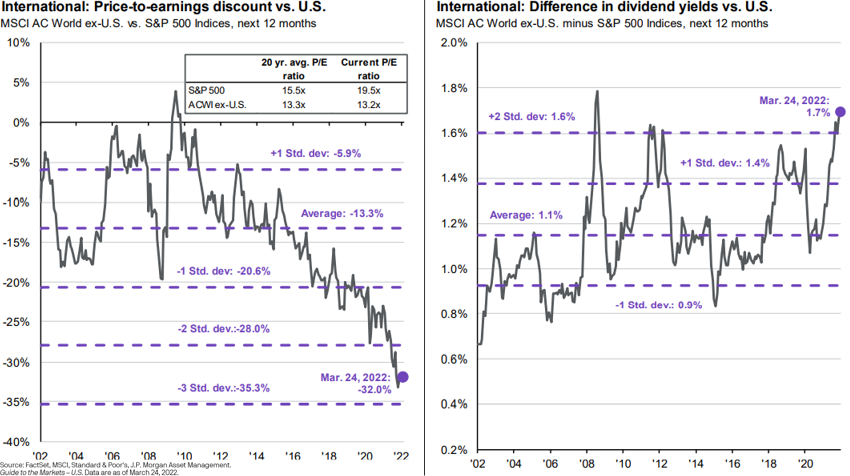
When looking at areas of the market to invest in, not only do we study the relationships mentioned above but we also study valuations. Global valuations for Europe, Japan, emerging markets, and China are all at or below their 25-year average, suggesting that stocks in these areas are underpriced. The international price-to-earnings discount vs. U.S. stocks is approaching the third standard deviation, which happens very rarely. This number represents the notion that international stocks are currently at a 32% discount to U.S. stocks, indicating potential opportunity. Additionally, dividend yields in the international sector are higher than U.S. dividend yields. This does not mean that international stocks will immediately outperform going forward, but it does indicate that international stocks are very undervalued compared to U.S. stocks, which is why we have been slowly building our positions in the international sector.
For more information, watch the full March 2022 Market Update video below.
Important Disclosures: The information provided here is of a general nature and is not intended to answer any individual’s financial questions. Do not rely on information presented herein to address your individual financial concerns. Your receipt of information from this material does not create a client relationship and the financial privileges inherent therein. If you have a financial question, you should consult an experienced financial advisor. Moreover, the hiring of a financial advisor is an important decision that should not be based solely upon blogs, articles, or advertisements. Before you hire a financial advisor, you should request information about the financial advisor’s qualifications and experiences. Past performance is no guarantee of future results. All expressions of opinion are subject to change without notice in reaction to shifting market conditions. Data contained herein from third party providers is obtained from what are considered reliable sources. However, its accuracy, completeness or reliability cannot be guaranteed. Examples provided are for illustrative (or “informational”) purposes only and not intended to be reflective of results you can expect to achieve. AllGen Financial Advisors, Inc. (AllGen) is an investment advisor registered with the SEC. AllGen does not provide personal financial advice via this material. The purpose of this material is limited to the dissemination of general information regarding the services offered by AllGen. The Disclosure Brochure, Form ADV Part II, which details business practices, services offered, and related fees of AllGen, is available upon request.


