Read through the blog here, or skip to Jason’s October 2024 Market Update Video below
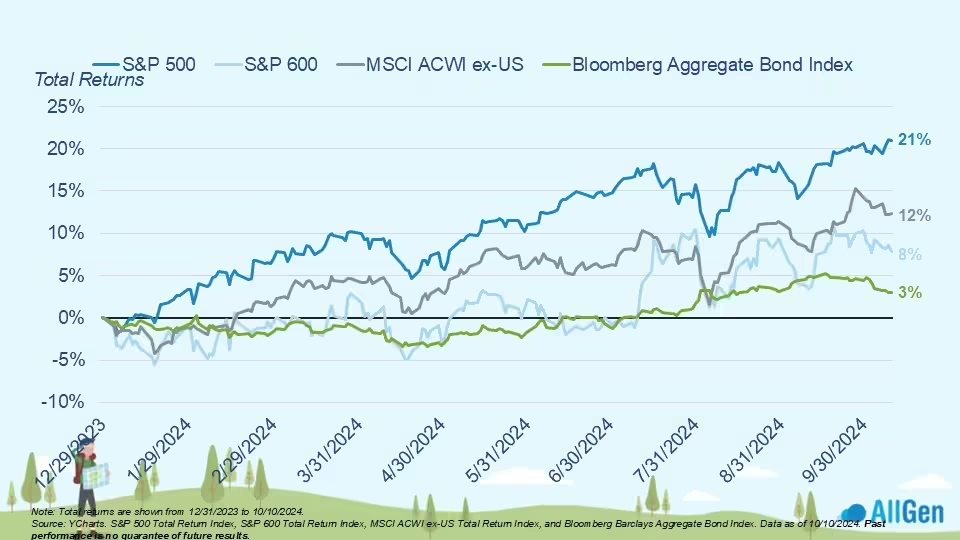
2024 is shaping up to be a strong year for markets as we enter the final stretch into the holiday season. The S&P 500, made up of large U.S. stocks, has grown 21% for 2024 as of October 10, and has kept its lead among other broad market indices. International stocks are in second place, up 12% over the same time period, followed by small cap stocks (S&P 600) which are up 8%. Bonds are in last place after spending the first half of 2024 in negative territory – up about 3%.
Year to Date Returns for 2024
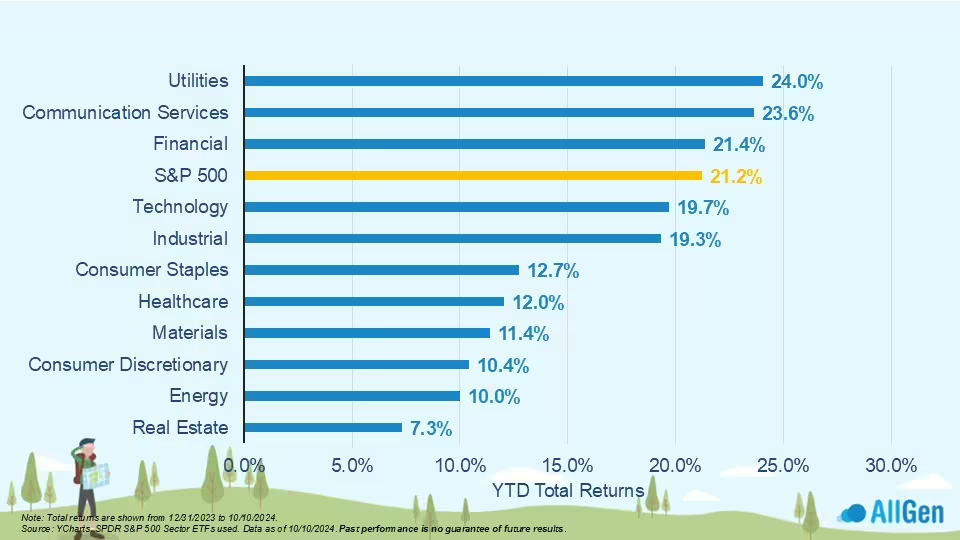
Stock sector performance
Among stock sectors, we’re beginning to see a shift in performance leadership with utilities taking the top spot from Technology. Interest rates have begun to decline, which can be good for companies that are highly leveraged like utilities since it reduces borrowing costs. Technology is now in 4th place after its pullback in July. The AI boom has been a large contributor to the strong performance of technology since the start of 2023 and it now seems that some of the euphoria around AI has worn off.
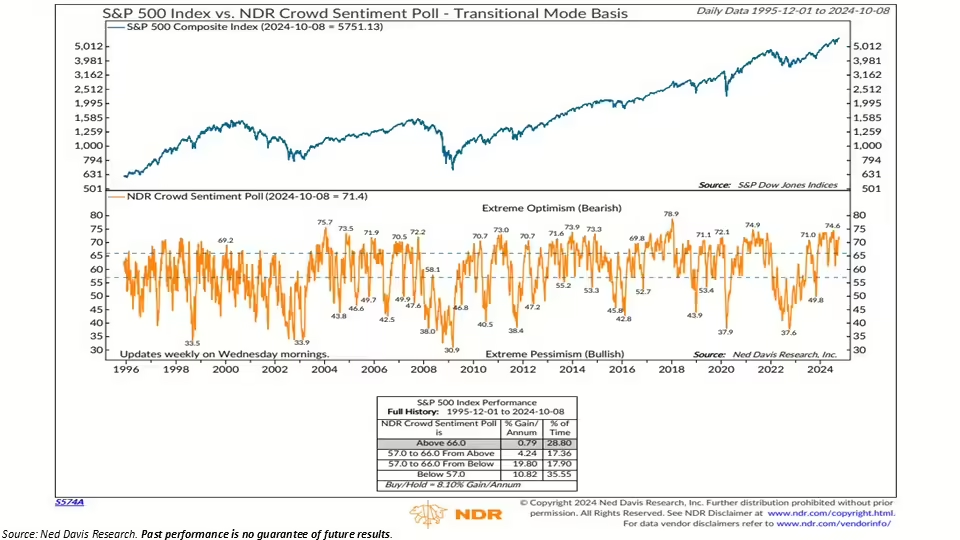
Sentiment can paint a picture of direction
Market sentiment measures how investors feel about markets and is heavily analyzed throughout the industry. Like a pendulum, investors cycle from optimistic to pessimistic, swinging from one to the other. In the chart below, the orange line measures market crowd sentiment; a higher value would indicate optimism among investors, and a lower value would indicate pessimism. Over the last 30 years or so, 28% of the time sentiment values were above 66 (heavy optimism) however, the subsequent return of the S&P 500 averaged under 1%. On the flip side, 35% of the time sentiment values were below 57 (pessimistic) where the subsequent return of the S&P 500 averaged 10.82%. Historically, markets have performed better after periods of low (pessimistic) sentiment. Currently, sentiment levels are elevated above 66.
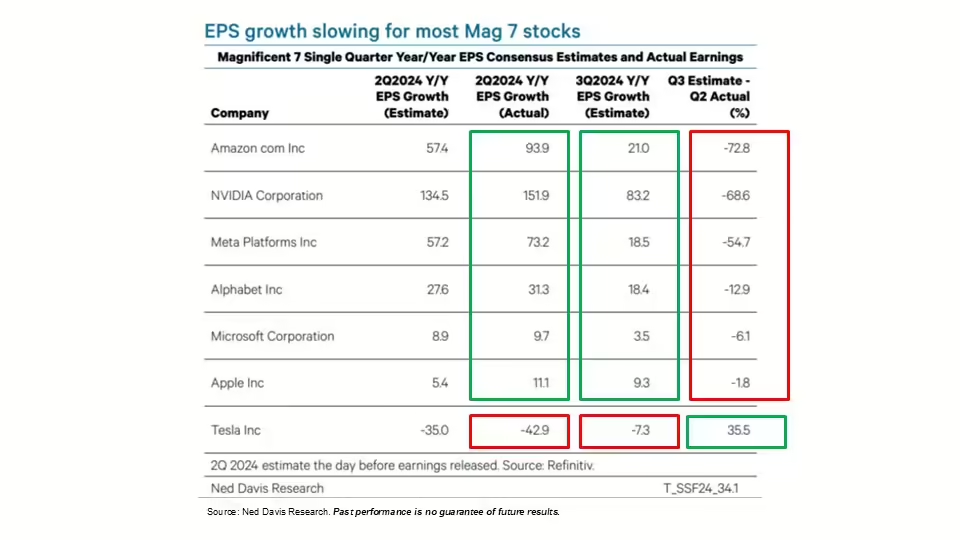
MAG 7 growth rates are slowing
The magnificent 7 (Amazon, NVIDIA, Meta, Alphabet, Microsoft, Apple, and Tesla) have contributed significantly to the growth of markets and have had stratospheric runs over the last few years. In the second quarter of this year, all Mag 7 stocks except Tesla reported substantial earnings per share (EPS) growth. Earnings per share is calculated by taking the company’s net income and dividing by number of shares outstanding. In the chart below, we can see Q2 EPS growth was substantial, however as companies prepare their third quarter earnings releases, estimates of what earnings could be are significantly lower. The red rectangle on the right indicates the difference between actual Q2 earnings growth and Q3 expected earnings growth; a notable decline in momentum.
Price to earnings ratio
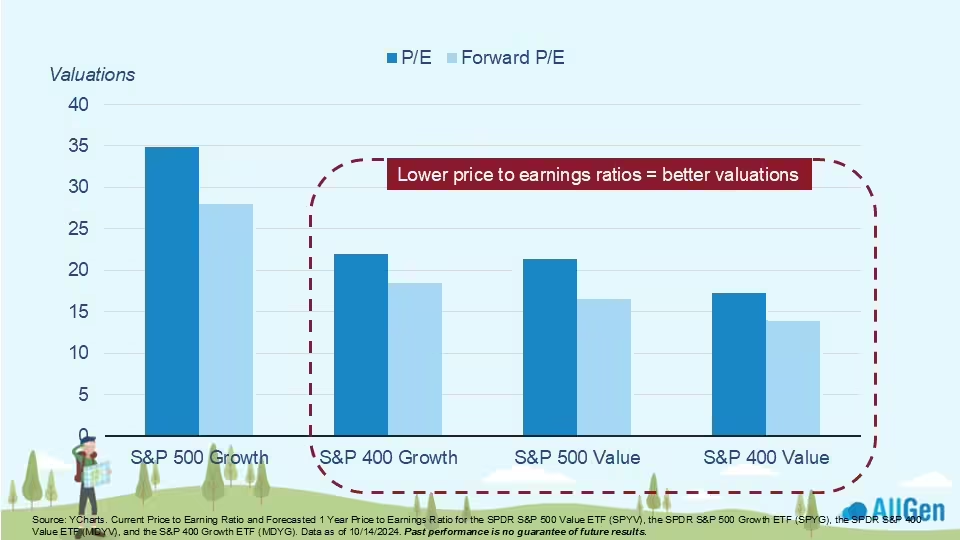
When examining price to earnings (stock price divided by earnings per share), we can see that large U.S. growth stocks are trading at higher valuations. The lower the P/E ratio the better the stock is thought to be valued.
Growth stocks typically are fast-growing, risky, and highly priced relative to earnings, and mostly technology-based. Value stocks typically have steady growth, established businesses, and are more attractively priced relative to earnings and other valuation metrics.
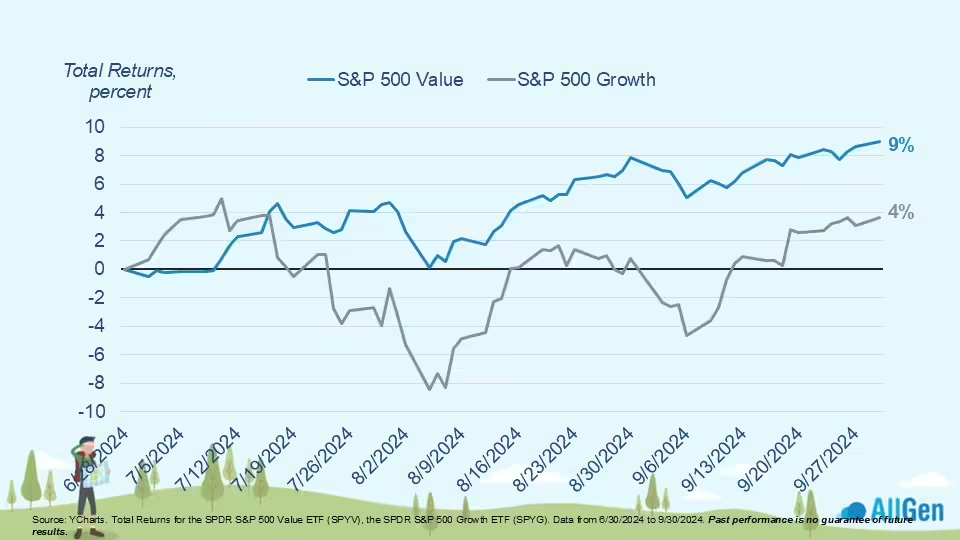
Large cap value outperformed large cap growth in Q3
The chart below looks at the majority of Q3 2024 and charts growth stocks and value stocks in the S&P 500 where Value stocks (blue line) have notably outpaced growth stocks (gray line) indicating a rotation from growth to value in markets.
International is cheap because earnings are lower
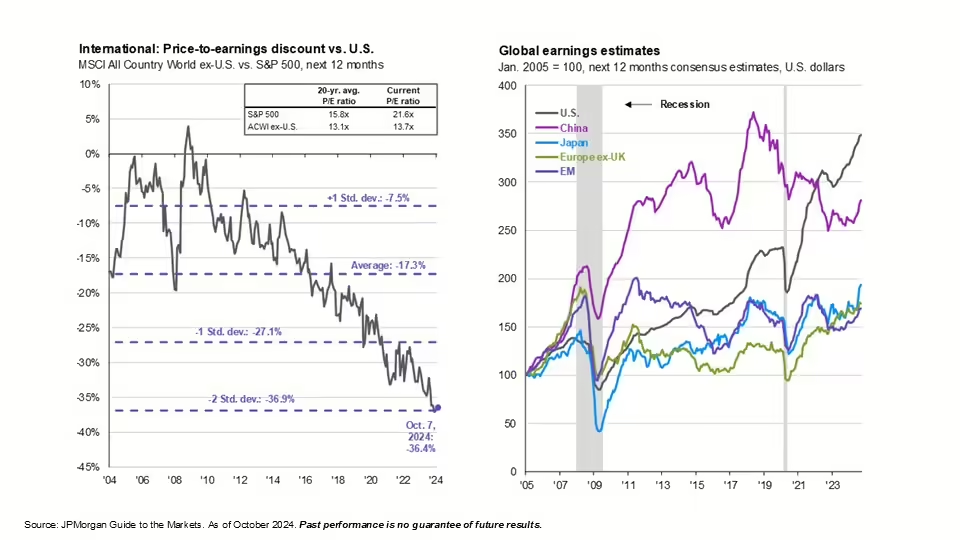
We continue to point out the relationship between U.S. stocks and international stocks and how attractive international markets look when comparing respective valuations. Historically speaking, price to earnings ratios for international stocks vs U.S. stocks are two standard deviations discounted (Chart on left).
We’ve pointed out this relationship for several quarters now, yet U.S. stocks have continued to dominate global markets. Stock prices are largely driven by expectations and the chart on the right-hand side examines earnings estimates for several of the countries with larger economies where the U.S. leads the pack. Innovation and shareholder friendly policies continue to support strong stock performance in the U.S., but the recent jump in global earnings estimates isn’t lost on us – that is why we continue to hold international stocks.
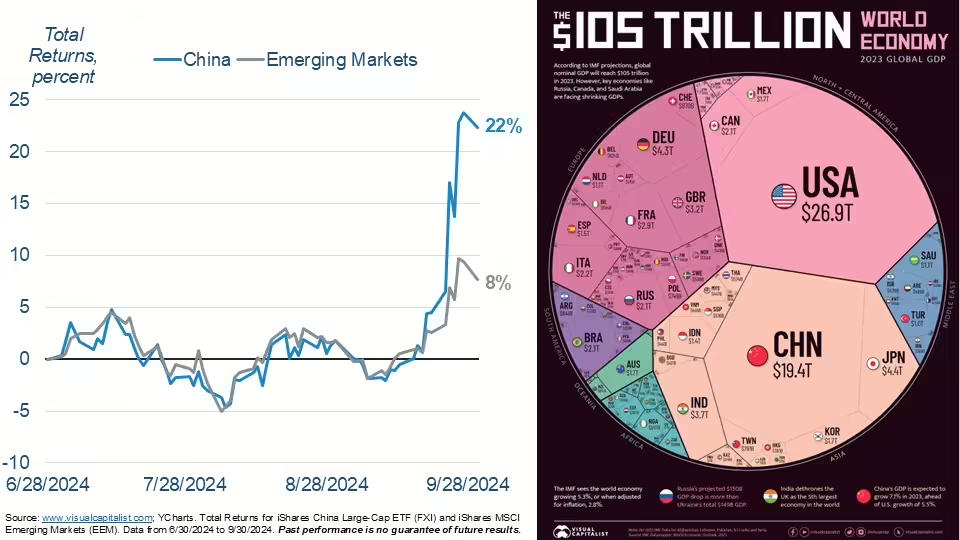
China’s stimulus pulls up the emerging market stock index
China announced interest rate cuts in the 3rd quarter of 2024 which catapulted Chines stocks on the news. China is also the largest emerging market country and the world’s second largest economy, behind the U.S. Chinese stocks are showing signs of life after spending much of the third quarter flat as China’s government announced massive stimulus measures to support its economy. .
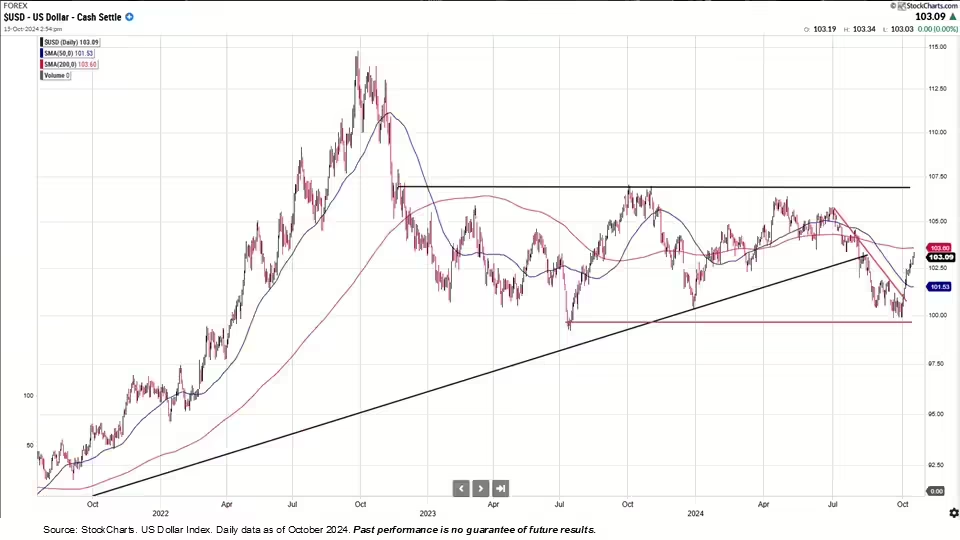
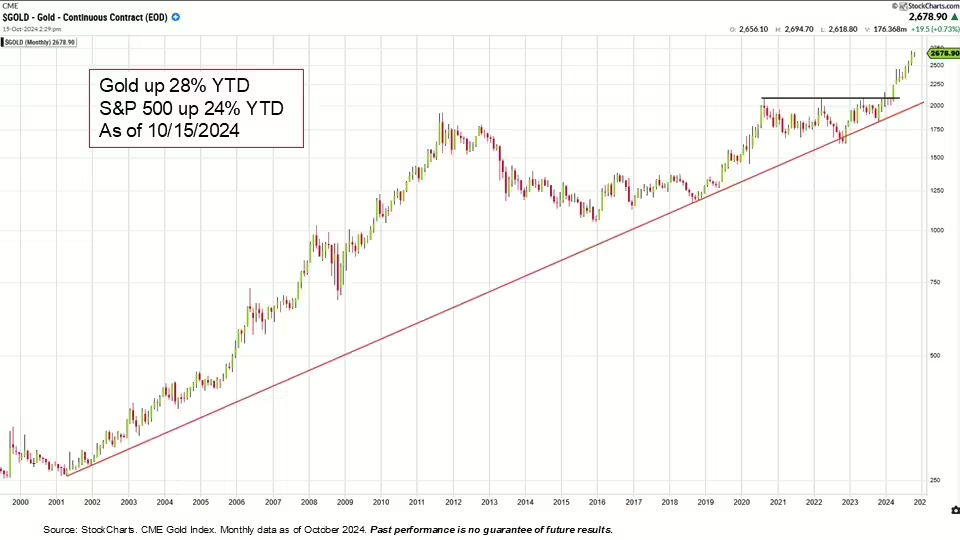
Shifting to the strength of the dollar, the dollar continues to remain rangebound and has been for much of the last couple of years; see in the below-chart how the dollar appears to be bouncing off the two horizontal lines on the right. 2022 saw major appreciation in the strength of the dollar as the Federal reserve began aggressively hiking interest rates to combat inflation. Although Americans saw inflation during this time, the dollar strengthened in comparison to other global currencies. Until October, the dollar was gradually weakening on expectations for Federal Reserve rate cuts. Meanwhile, gold prices are on the rise – typically performing well when the dollar weakens or interest rates fall (see second chart below).
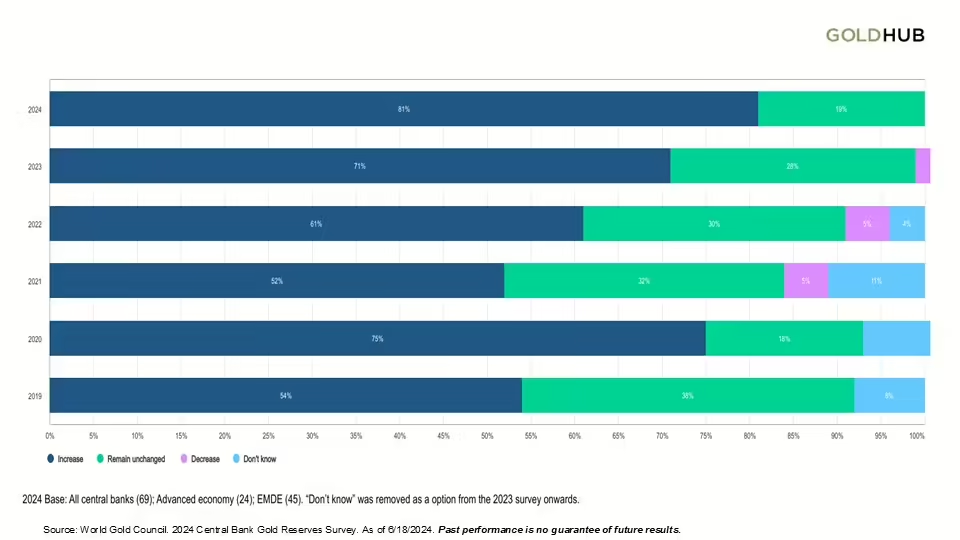
Further expanding on the price of gold, a recent Central Bank Gold Reserves Survey came back with 81% of central banks saying they intend to increase their gold holdings in 2024 with no central banks expected to decrease their holdings. This can increase market demand for gold, which is supportive of rising gold prices. According to the World Gold Council, central banks will tend to hold gold for a number of reasons, mostly for its inflation hedge and better performance during periods of crisis. As active investment managers, we incorporate gold into client portfolios for similar purposes.
Housing inflation is very slow to come down
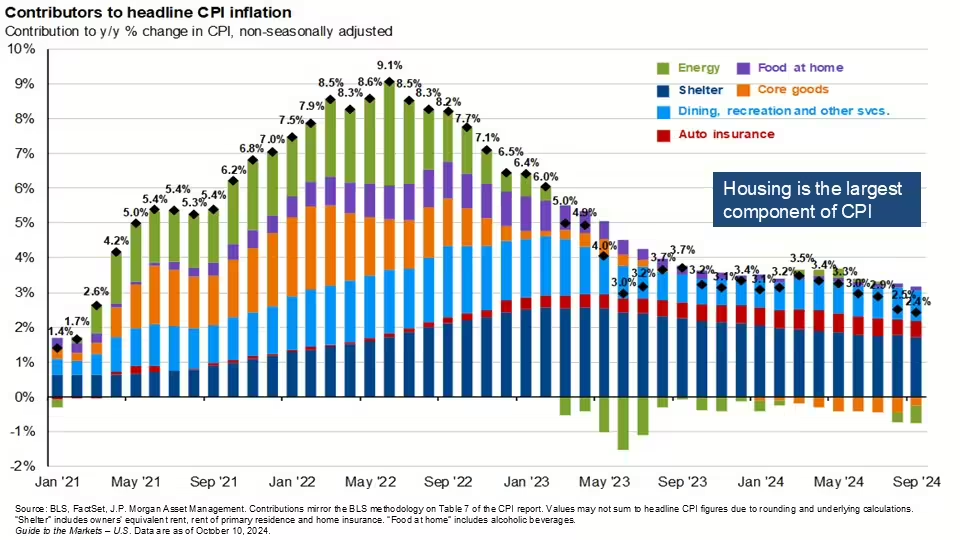
Inflation had dominated headlines over the last several years and rightly so, as overall inflation hit 30- and 40-year highs back in May of 2022 – 9.1% at its highest point. As depicted by the many different colors in the chart below, inflation is made up of several different components like energy, food, and shelter to name a few. While Inflation has significantly come down, it remains above the 2% target. Although most inflation categories have decreased, the largest component, as well as the most stubborn, has been housing (dark blue bar) and while it has decreased it is still elevated.
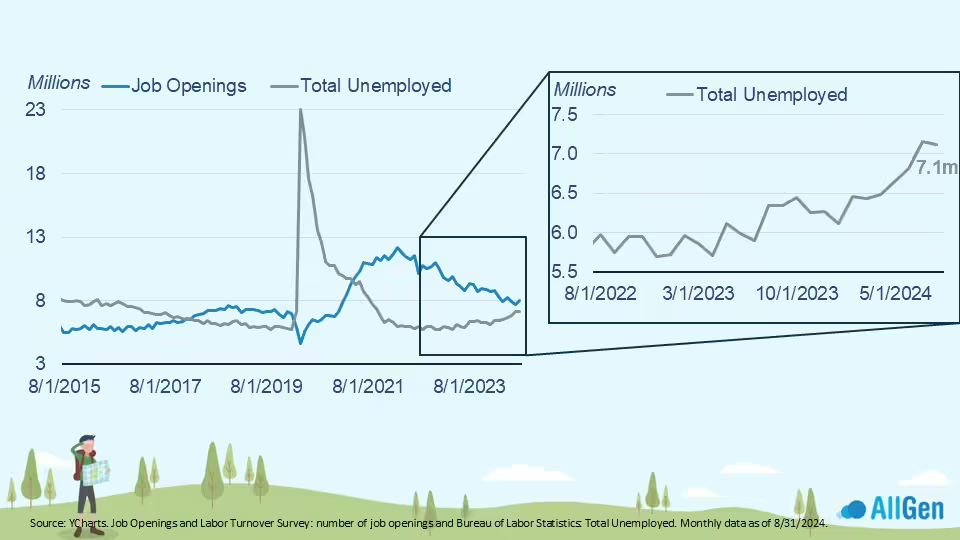
The worker shortage has gone from 1.5 million to 925 thousand people
Along with monitoring inflation, the Fed will also monitor the labor market, which seems to be improving from a labor shortage standpoint. The U.S. has been in a labor shortage since 2021 with more job openings than available workers. This means companies must pay higher wages to attract or retain employees which further drives up wages and inflation. Rising unemployment has historically led to higher probabilities of recession and while this doesn’t mean we’re heading that direction, it does mean we’re taking steps in portfolios to manage risk properly.
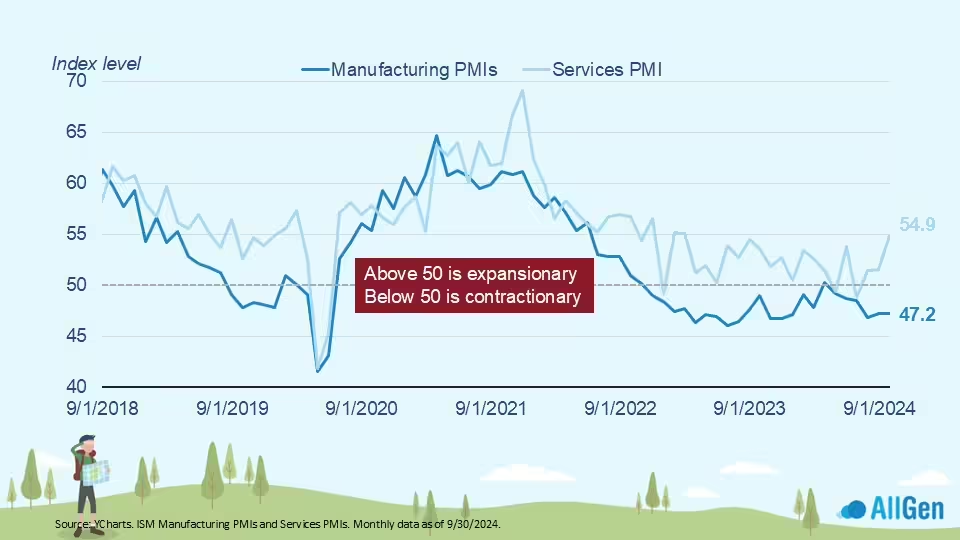
Services surprised to the upside
The U.S. at one point in history was dominated by manufacturing which over the decades has shifted to a more services-based economy. In the chart below, we measure contractionary and expansionary values between manufacturing and services industries in the U.S. and can see that service industries are expanding whereas manufacturing is contracting (values above 50 is expansionary and values below 50 are contractionary).
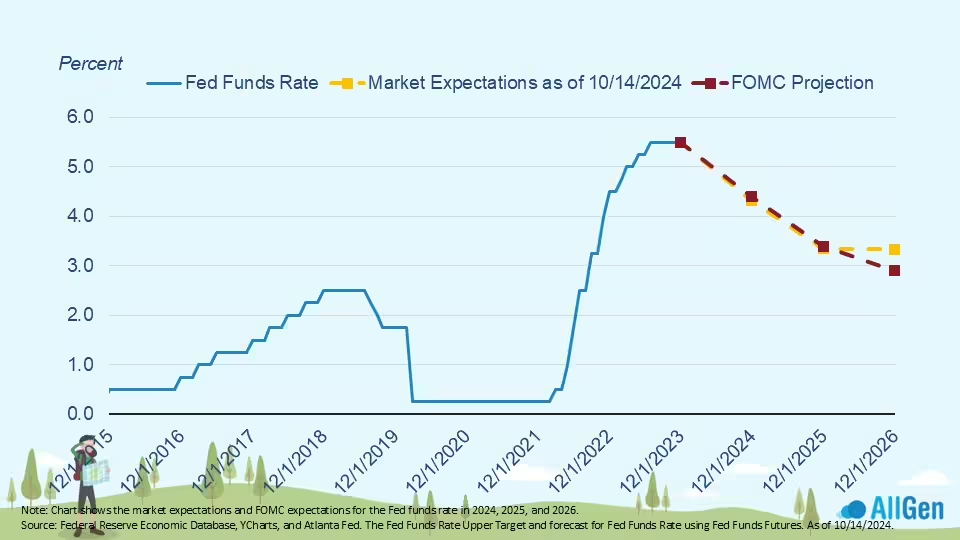
Markets are pricing in an 82% chance of 2 more rate cuts before year end
At the Fed’s September meeting of 2024, officials decided to cut interest rates by 50 basis points (two rate cuts). By the end of the year, markets believe there’s an 82% chance there’ll be another 50 basis point cut. Expectations sometimes vary from actual FOMC Projections. In the last several market commentaries, we’ve pointed out disparities in market expectations and FOMC projections however, currently, they’re more in line.
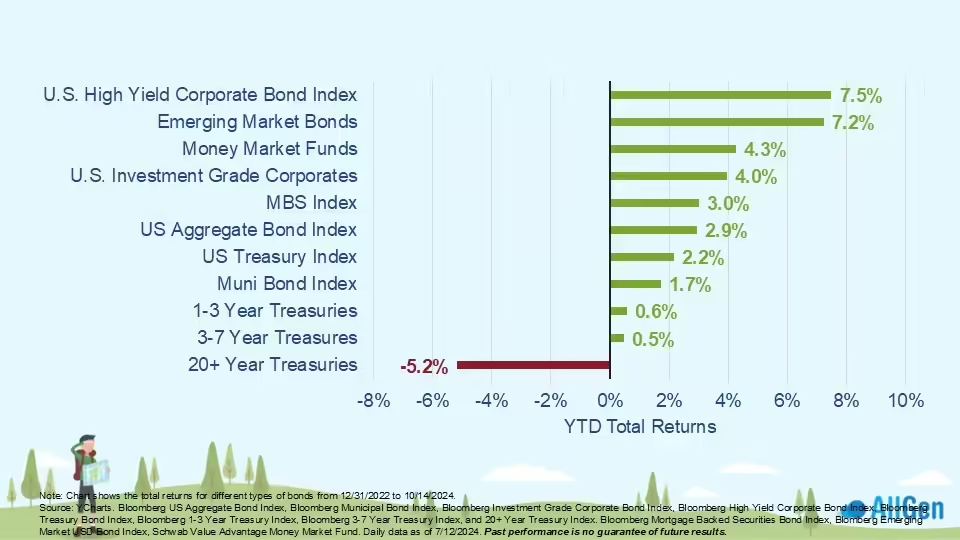
Most bonds are up year to date
Bonds are coming off their worst performance on record. Yet, most bonds are up year to date. Some of the top performers are U.S. high yield corporates, emerging market bonds, and money market funds. Typically, declining interest rates are good for bond prices (prices move inversely to yields). We’ve started increasing our bonds exposure in anticipation of this while also monitoring inflation; if inflation remains elevated, bond prices might struggle for longer.
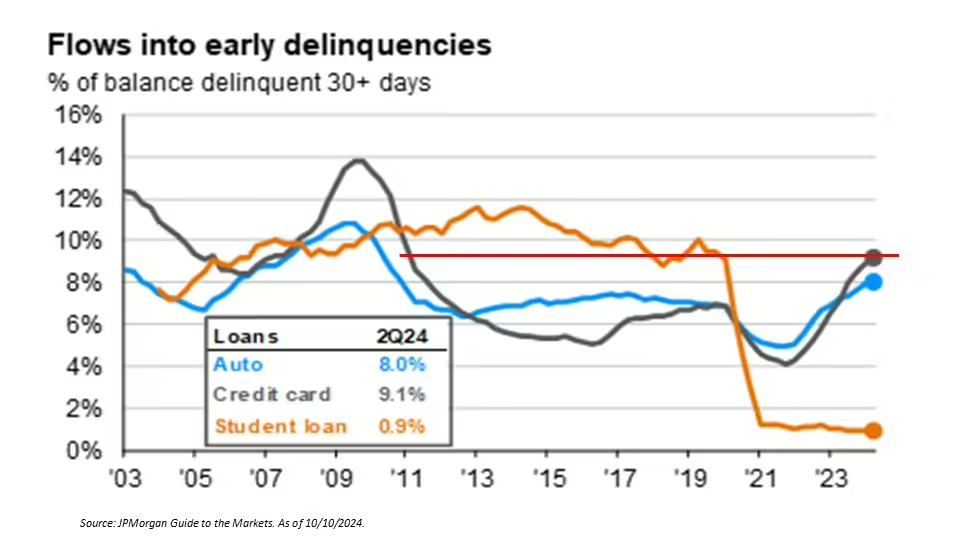
Delinquencies are still trending higher, albeit slowly
The U.S. predominantly relies on consumers to drive economic growth and when consumers decrease spending, economic growth tends to sputter. Monitoring the health of the consumer remains a priority as delinquencies of auto loans and credit cards approach 15-year highs.
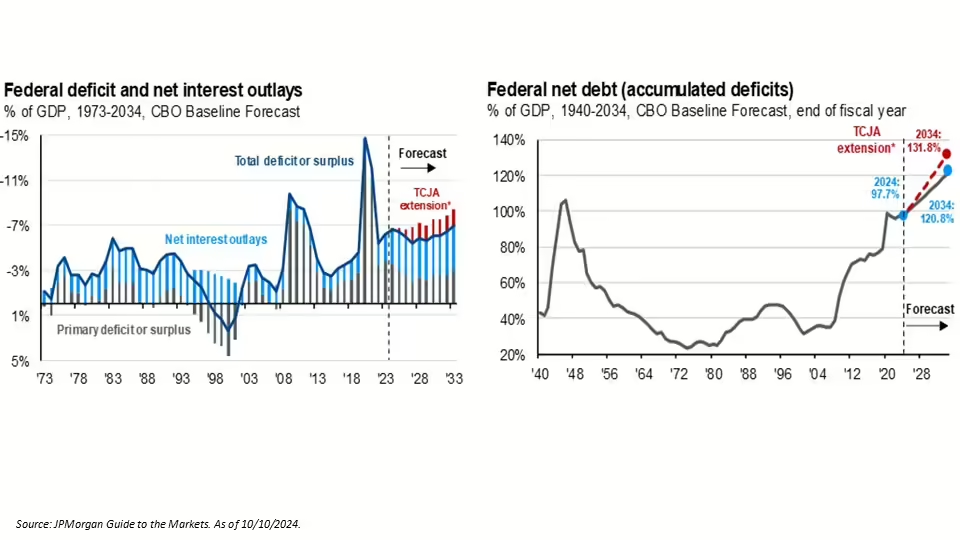
The CBO forecasts deficits to rise due to interest costs and the potential tax cut extension
The U.S. is currently running a very high deficit. With interest rates elevated, the U.S. now needs to use a significant portion of the budget just to pay interest on its debt, which is forecasted to increase (the light blue bars on the left). In the next chart, when factoring out inflation by taking the Federal deficit as a percentage of GDP, we can see that we are approaching levels not seen since the World War II era.
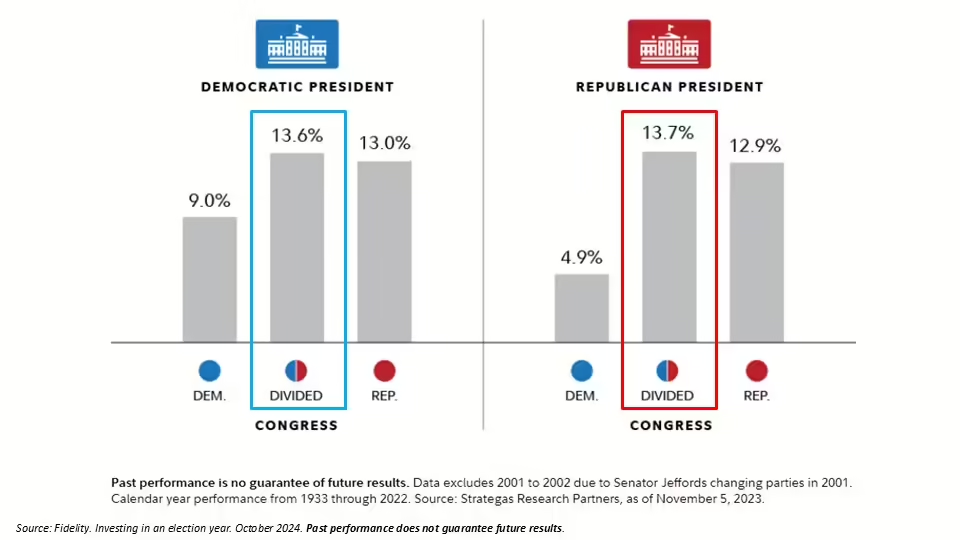
Average annual S&P 500 performance from 1933-2022
There’s been plenty of market scenarios in nearly the last 100 years where control over congress and the presidency has swung from republican control, democrat control and division between congress. Historically, when congress is divided between republicans and democrats, as it is today, the political party of the president had negligible affect to average markets returns and has typically performed best when congress is divided.
Keep Politics out of Your Investment Decisions
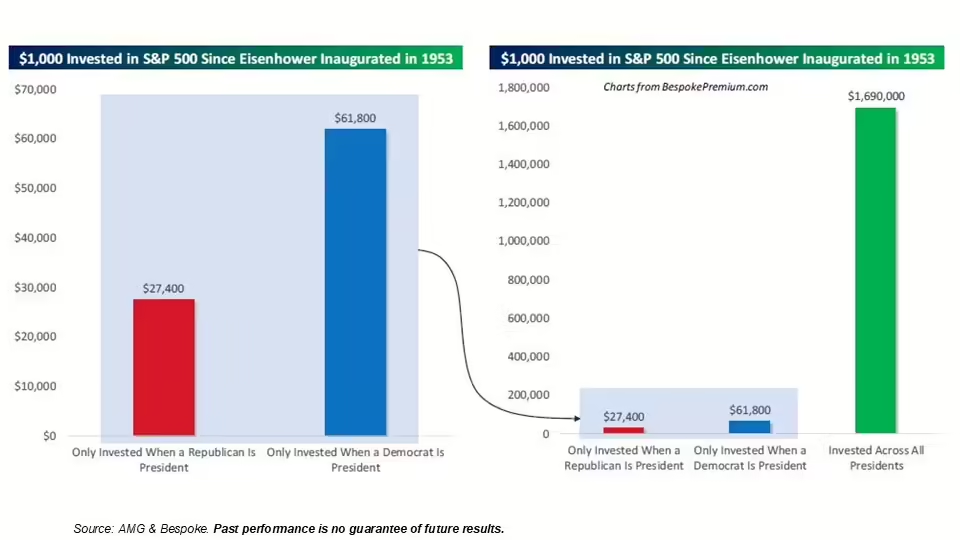
We’re no strangers to the unique political developments we’ve seen as election day in the U.S. approaches. Some individuals might feel inclined to make investment decisions based on certain outcomes of the election. We want to warn clients that the news media will be targeting your emotional connection with your money. Below, we illustrate a compelling argument that you should maintain your investments no matter who is in the White House.
Since President Eisenhower was inaugurated in 1953, we’ve calculated what the S&P 500 has returned if you only invested when a Republican was president vs. when a Democrat was president. If you started with $1,000 you would have $27,000 today if you only invested during Republican presidencies, and $61,000 if you only invested during Democratic presidencies. If you simply remained invested the whole time, your $1,000 investment would be $1,690,000. The power of remaining invested through political noise can offer much better outcomes than taking a political side with your investments.
Contact Your Financial Advisor
A well-diversified, disciplined strategy that manages risk first is what we strive to build for our clients. Contact your advisor to learn more about how AllGen can help manage risk in your portfolio!
For more information, watch the full October 2024 Market Update video below.
Important Disclosures: The information provided here is of a general nature and is not intended to answer any individual’s financial questions. Do not rely on information presented herein to address your individual financial concerns. Your receipt of information from this material does not create a client relationship and the financial privileges inherent therein. If you have a financial question, you should consult an experienced financial advisor. Moreover, the hiring of a financial advisor is an important decision that should not be based solely upon blogs, articles, or advertisements. Before you hire a financial advisor, you should request information about the financial advisor’s qualifications and experiences. Past performance is no guarantee of future results. All expressions of opinion are subject to change without notice in reaction to shifting market conditions. Data contained herein from third party providers is obtained from what are considered reliable sources. However, its accuracy, completeness or reliability cannot be guaranteed. Examples provided are for illustrative (or “informational”) purposes only and not intended to be reflective of results you can expect to achieve. AllGen Financial Advisors, Inc. (AllGen) is an investment advisor registered with the SEC. AllGen does not provide personal financial advice via this material. The purpose of this material is limited to the dissemination of general information regarding the services offered by AllGen. The Disclosure Brochure, Form ADV Part II, which details business practices, services offered, and related fees of AllGen, is available upon request.


