The Long and Short of It:

- Long-term stock charts point to a potential change of trend in the long-running bull market
- The Federal Reserve could be nearing the end of its current rate rising cycle
4th Quarter Review
US stocks had a difficult 4th quarter and its worst year since 2008. US large and small caps were down 13.5% and 20.1% for the quarter and down 4.4% and 8.5% for year. International stocks fell 11.5% for the quarter and were the worst performing area for the year, down 14.2%. Bonds were up 1.6% for the quarter, despite the FED raising rates another 0.25%, and were flat for the year. In this quarter’s market commentary, we look at the change of the trend of the overall stock market, the potential change of direction in Fed Policy, and how both issues could affect stocks and bonds.
Uptrend in Question
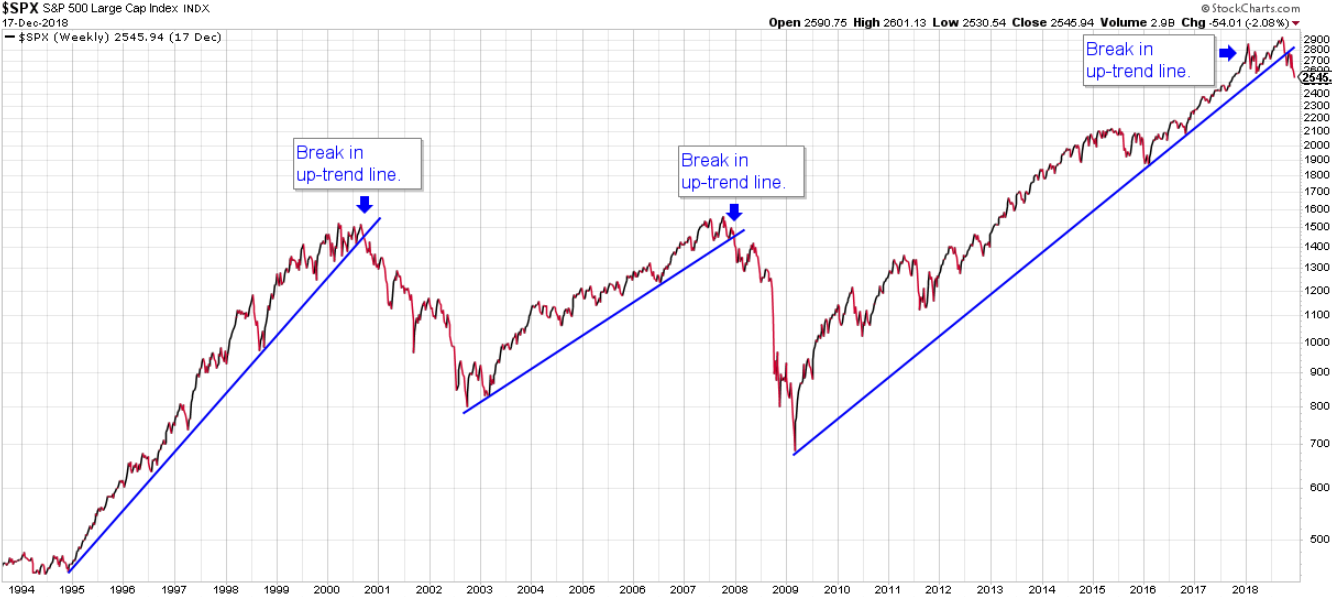
As we’ve mentioned in past articles, while it is very important to study economic indicators and fundamentals, it is equally important to study market trends from a technical charting basis. Price charts of stocks or stock indices (ie. S&P 500) usually give you clues as to what’s to come in the future and they tend to give you these insights before they are reflected in the economic indicators and the fundamentals. Recently the S&P 500 stock chart has broken down from a long-term up-trend. As you can see in the chart below, in the past when the market broke below its long-term uptrend line (prior times were 2000 and 2007), the market went into a significant down-trend and a bear market. However, no one knows the future, and all the analysis we do only helps us to make more informed decisions of what we believe will happen. We are humble enough to know, that we could be wrong and that’s why, with investing, you never put all your eggs in one basket. We have to also prepare for being wrong. For example, we often get asked: “If you think the market is going to drop why don’t you sell out of everything and go all cash and wait?” And the answer is, “Because we could be wrong, and if the market goes up and we are in cash, it has now put is in a very difficult position.” In such a case the quandry becomes when do I get back in as stocks continue to go up and FOMO (fear of missing out) kicks in. Should I get back into the market even if it is higher than when I sold or continue to miss out on market gains? What typically happens is the market goes higher until you can’t handle missing out any longer. So you reinvest into the market and it starts to fall from the now higher level… -then you’ve really made a mistake! You missed out on the gains, and you end up taking a larger loss when the market drops. This even happens to the smartest minds in the world. In 1995 after a very strong bull market, the President of the Federal Reserve at the time, Alan Greenspan, famously quoted that the market was displaying “irrational exuberance” pointing out that the astronomical market rise was not sustainable.1

If one was to sell out of the market in 1995 and go all cash when the S&P 500 index was at the price level of around 550, then they would have missed out on a 200% rise in the market over the next 5 years until the market finally turned in the year 2000. We highly discourage clients from trying to go all cash to avoid a market drop. A recent Dalbar study shows the average equity investor returns over a 30 year period (1986-2016) are around 4% a year while the S&P 500 returned 10% annually.2 The study makes the point that investors are their own worst enemy and constantly mistime the market by selling low and buying high (the opposite of what you should do). That’s why, instead of going all cash, we have reduced stocks and increased safe-haven assets like US Government bonds and money markets. This can help protect us if the market goes down, but if we are wrong and the market continues to go up we should fare well.
The Federal Reserve Could Be Nearing the End of the Current Rate Rising Cycle
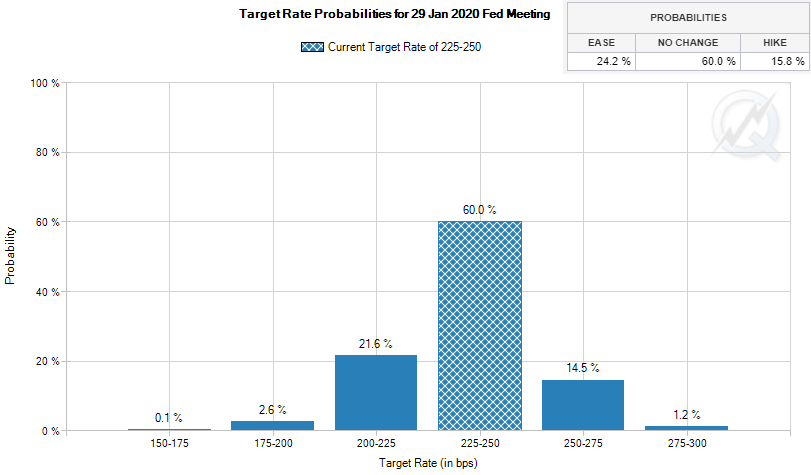
The Federal Reserve (FED) recently raised rates another 0.25% in December for a total of 4 rate hikes totaling a full 1.0% rise in interest rates for 2018. This brings our current range for the Federal Funds rate to 2.25%-2.5%. At the same time, as we have mentioned in prior market commentaries, the FED continues to do quantitative tightening. Rising rates and quantitative tightening led to interest rates rising to 7-year highs in 2018. Both forces tend to slow down the economy. People and companies that are in debt have seen their borrowing costs rise, which means reduced cashflow (bad for economy). The economy starts to slowdown and markets start to drop near the end of a rate rising cycle. With the recent large drop in the market and some economic indicators starting to cool off. The FED as hinted at pausing or slowing down on interest rate hikes. However, Federal Fund rate futures (see chart on right) show that the market is predicting, by this time next year, that interest rates will be the same as they are now. What’s more interesting is that there

(Source: https://www.cmegroup.com/trading/interest-rates/countdown-to-fomc.html As of 1/10/2019 )
is a higher probability of a rate cut then a rate hike. So, what does this mean for stocks and bonds? For stocks it means that the market is anticipating a weaker economy (potentially bad for stocks). However, for bonds this is potentially a good sign, as bonds tend to perform better when interest rates stay flat or go down. In our client’s portfolios we have been reducing stocks and increasing bonds. Also, we have been increasing the duration of our bonds (more longer-term bonds).
Going Forward
The stock market appears to have broken down from a long-term uptrend. The Federal Reserve looks like they may pause interest rate hikes as the futures market for the Fed Funds Rates alludes to rates not rising over the next year. These two factors show potentially difficult times for stocks while potentially better opportunities for bonds in the foreseeable future. As such, we have become more defensive on the stock side of our portfolios while increasing exposure and duration to the bond side of our portfolios. We will continue to monitor the markets, economies, interest rates, currencies, sentiment, and many other indicators to try to stay ahead of the markets as we look to preserve and grow our client’s wealth. Our investment philosophy is to manage risk first in an effort to avoid a major loss, as we seek to outperform markets over a full market cycle net of our management fee. We appreciate your trust and confidence in us!
1 “Irrational Exuberance” Book by Robert Shiller
2 Source: (https://seekingalpha.com/article/4108688-investor-returns-vs-market-returns-failure-endures)
Written by: Jason Martin, CFP®, CMT, Chief Investment Officer, Paul Roldan, Chief Executive Officer; Christina Shaffer, Analyst Allgen Financial Advisors, Inc.;
Important Disclosures: The information provided here is of a general nature and is not intended to answer any individual’s financial questions. Do not rely on information presented herein to address your individual financial concerns. Your receipt of information from this material does not create a client relationship and the financial privileges inherent therein. If you have a financial question, you should consult an experienced financial advisor. Moreover, the hiring of a financial advisor is an important decision that should not be based solely upon blogs, articles, or advertisements. Before you hire a financial advisor, you should request information about the financial advisor’s qualifications and experiences. Past performance is no guarantee of future results. All expressions of opinion are subject to change without notice in reaction to shifting market conditions. Data contained herein from third party providers is obtained from what are considered reliable sources. However, its accuracy, completeness or reliability cannot be guaranteed. Examples provided are for illustrative (or “informational”) purposes only and not intended to be reflective of results you can expect to achieve. AllGen Financial Advisors, Inc. (AllGen) is an investment advisor registered with the SEC. AllGen does not provide personal financial advice via this material. The purpose of this material is limited to the dissemination of general information regarding the services offered by AllGen. The Disclosure Brochure, Form ADV Part II, which details business practices, services offered, and related fees of AllGen, is available upon request.


